
 While there are numerous analyses indicating that current National Determined Contributions (NDCs) made the Parties to the Paris Agreement do not put the world on track to meet the treaty’s objectives of “holding the increase in the global average temperature to well below 2 °C above pre-industrial levels and to pursue efforts to limit the temperature increase to 1.5 °C above pre-industrial levels.” However, very few efforts have been made to date to ascertain how to track progress in meeting the temperature targets of Paris. This can be a critical component of informing the treaty’s global stocktaking process (Art. 14) and provisions to increase the ambition of commitments (Art. 3; 4). In a new study published in the journal Nature, Peters, et al. employ a nested structure of a group of indicators intended to track the progress of parties to Paris in meeting their Paris obligations, including aggregated progress, country-level decompositions to track emerging trends, and technology diffusion.
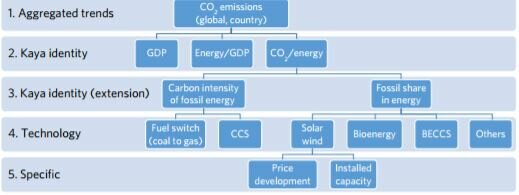
Among the conclusions of the study:
- While global carbon dioxide emissions have been flat for the past three years (projected to be 36.4 GtCO2 in 2016), cumulative emissions continue to rise, which will preclude meeting Paris’s objectives given the need for rapid declines in emissions, and ultimately zero emissions;
- While Chinese emissions have been largely stable recently, and US and EU emissions have declined in the past few years, it’s unclear if these are long-term trends, or largely attributable to weak economic growth or other short-term factors.
- There is empirical evidence of emerging declines in carbon intensity globally, including the China, the United States and the European Union
- While the growth of the use of renewable energy has been substantial in recent years, including more than 50% of total energy growth in 2015, it will prove difficult for renewable energy to supply annual energy growth in the short term absent further declines in global energy use. Renewable energy alone may also not be sufficient to keep global temperatures below 2C given physical constraints to large-scale deployment and limited prospects for use in certain sectors, such as agriculture;
- While it is possible to keep temperature increases to 2C or below with relatively high fossil fuel energy use, this scenario is predicated on substantial reliance on bioenergy, coupled with large-scale deployment of carbon capture and sequestration (CCS). However, this assumes that bioenergy can be sustainably produced and made carbon-neutral. It’s also predicated on huge scale-up of CCS in conjunction with bioenergy (BECCS). This may require as many as 4000 facilities by 2030 compared with the tens currently proposed by 2020. Scale-up of this magnitude may prove to be a large challenge given social resistance and inadequate assessment of technological risks;
- Studies indicate that current emissions pledges may “quickly deviate” from what is required to conform to the 2C objective. Should some technologies lag in deployment, others will have to ramp up more quickly. These is also a lack of scenarios assessing the prospects for transformational changes in lifestyle and behaviors, other forms of carbon dioxide removal, and solar radiation management geoengineering.
Among potential questions for classroom discussion are the following:
- What are the challenges associated with large-scale deployment of bioenergy and carbon capture and sequestration/storage? What policy measures could help to ameliorate these challenges;
- What are the potential benefits of solar radiation management geoengineering; what are the potential risks;
- What measures could be taken to accelerate market penetration of renewable energy?
Poster’s note: There is an interview with Glen Peters that further explicates some of the findings of this study.
